Globally, business executives rely extensively on data and analytics for decision making. With the tremendous amount of data that is being churned out by individuals, businesses, systems etc., it is becoming increasingly complex for executives to make business sense from the enormous data that is at their disposal. Further, data alone is normally not useful to the decision makers unless it is analyzed, interpreted, organized and presented in a visually appealing manner. A lot of individuals and businesses make use of diverse visualization tools to create impressive charts. While there are a number of tools available in the market for data visualization, Google Charts stands out in many ways.

Google Charts, when integrated with SharePoint, can be immensely useful to business executives and other knowledge workers to dramatically improve their ability to comprehend and present information utilizing interesting visualizations. Data can be visualized in SharePoint in different ways. Below are some of the options:
- SharePoint Services along with any JavaScript API (Chart.js, Google Charts, Highcharts, D3.js etc.)
- Chart Web Part (Depreciated from SharePoint 2013 onwards)
It is important to note that if you are using SharePoint version available in Office 2013, the Chart Web Part feature is no longer available. The alternate way is to make use of any JavaScript Chart API to visualize the data in SharePoint. In this post, we explain how Google Charts API can be used to visualize the data.
Here are a few compelling reasons to choose Google Charts over other JavaScript Charts:
- Free to Use – With no cost for using and excellent compatibility with SharePoint, there’s no reason not to try it.
- Rich Gallery – Choose from a variety of charts, from simple scatter plots to hierarchical tree maps.
- Highly Customizable – Configure the charts to perfectly match the look and feel of your project/website/intranet.
- HTML5-SVG Compatible – Google Charts is cross-browser compatible, cross-platform portable and mobile friendly. Furthermore, no additional plugins are required.
- Dynamic Data – Connect your data in real time using multiple data connection tools.
Integrating Google Charts in SharePoint 2013
Here’s a step-by-step process to visualize data using Google Charts API in SharePoint 2013.
Step 1
- Log in to Office 365 and navigate to SharePoint Online.
- The first step is to create a web page in SharePoint where you intend to showcase Google web charts. Below is the process to create a web page in SharePoint.
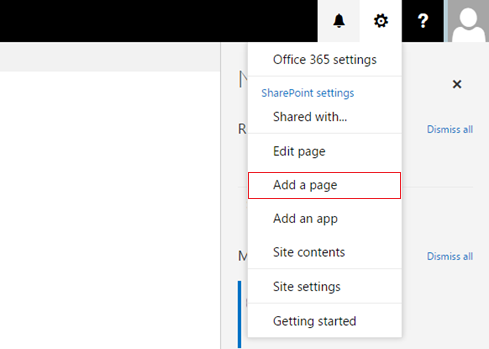
- Click on the ‘Settings’ icon and then select ‘Add a page’. Give a preferred name to the web page and save the page. In this illustration, we have named the web page as ‘Charts Demo’.
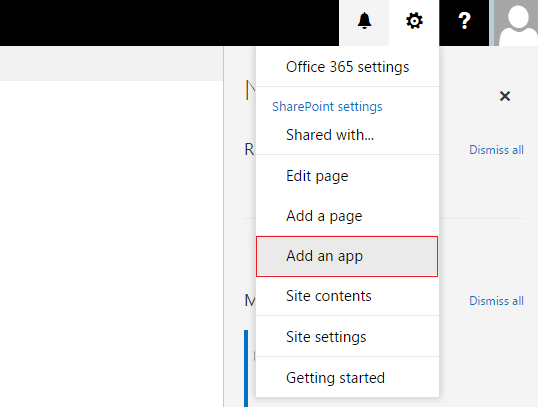
- The next step is to create a new ‘Custom List’. Here’s the process to create a ‘Custom List’: Click on the ‘Settings’ icon available on the top right corner of your browser and then select the option ‘Add an app’.
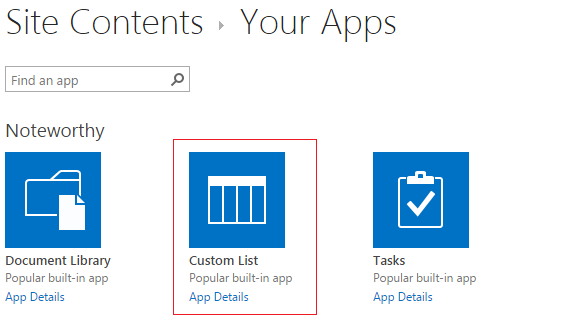
- Then click on the ‘Custom List’ component displayed on the Site Contents screen.
- Provide a unique name to the custom list. Here, we have named the custom list as ‘smartphone_sales’.
Step 2
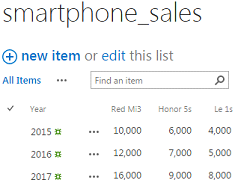
Visit your ‘Site Contents’ page by clicking on the Settings > Site Contents and ‘smartphone_sales’ tab and then edit the ‘custom list’ as shown below.
- Rename the title column depending on your preference. In this case, we have renamed it as ‘Year’.
- Click on the ‘+’ button to add new columns (data type). Here, we have added three new columns titled ‘Red Mi3’, ‘Honor 5s’ & ‘Le 1s’.
- Subsequently, you can add data to the list by clicking on ‘new item’ or ‘edit’ options.
- Add ‘smartphone_sales’ custom list to the ‘Charts Demo’ page.
- Go the ‘Charts Demo’ page and click on the ‘Edit’ option available on the right side of the page.
- Click on the ‘Insert’ tab and then select ‘Web Part’ and select the list, click on the ‘Add’ button and save the web page.
Step 3
There are two methods to include Google Charts API in SharePoint
- Method 1 – Download the dependencies and save these in ‘Site Content’ > ‘Site Assets’
- Method 2 – Include dependencies directly using the below URLs. In our example, we have followed this method.
Dependent Libraries
https://www.gstatic.com/charts/loader.js
https://cdnjs.cloudflare.com/ajax/libs/jquery.SPServices/2014.02/jquery.SPServices.min.js
Adding the code snippet to the web page in SharePoint
- Go to the ‘Charts Demo’ page and click on the ‘Edit’ option (top right side).
- Add the ‘Script Editor’ to the page by following the below instructions (refer to the below screenshot).
- Click on the ‘Edit Web Part’ option as shown below.
- Copy and paste the code snippet in the ‘Web Part’ and click on the ‘Insert’ button and save the page.
 Google Charts API Code Snippet
[html]
<html>
<head>
<script src="https://www.gstatic.com/charts/loader.js" type="text/javascript"></script>
<script src="https://code.jquery.com/jquery-3.0.0.min.js" type="text/javascript"></script>
<script src="https://cdnjs.cloudflare.com/ajax/libs/jquery.SPServices/2014.02/jquery.SPServices.min.js" type="text/javascript"></script>
<script language="javascript">
var returnedItems = null;
function loadGoogleLibAndDraw(){
google.charts.load(‘current’, {‘packages’:[‘bar’,’line’]});
google.charts.setOnLoadCallback(visualizeData);
}
function visualizeData() {
var context = new SP.ClientContext();
var list = context.get_web().get_lists().getByTitle(document.getElementById(‘customListName’).value);
var caml = new SP.CamlQuery();
caml.set_viewXml("<View></View>");
returnedItems = list.getItems(caml);
context.load(returnedItems);
context.executeQueryAsync(onSucceededCallback, onFailedCallback);
}
function onSucceededCallback(sender, args) {
var data = new google.visualization.DataTable();
data.addColumn(‘string’, ‘Year’);
data.addColumn(‘number’, ‘Red Mi3’);
data.addColumn(‘number’, ‘Honor 5s’);
data.addColumn(‘number’, ‘Le 1s’);
var enumerator = returnedItems.getEnumerator();
var markup = ”;
while (enumerator.moveNext()) {
var row = [];
var listItem = enumerator.get_current();
row.push(listItem.get_item(‘Title’));
row.push(listItem.get_item(‘sezq’));
row.push(listItem.get_item(‘_x0063_977’));
row.push(listItem.get_item(‘_x0077_q11’));
data.addRow(row);
}
var options = {
chart: {
title: ‘Sales Trend’,
},
bars: ‘vertical’
};
var barChart = new google.charts.Bar(document.getElementById(‘BarChart’));
barChart.draw(data, options);
var lineChart = new google.charts.Line(document.getElementById(‘LineChart’));
lineChart.draw(data, options);
}
function onFailedCallback(sender, args) {
var markup = ‘<p>The request failed: <br>’;
markup += ‘Message: ‘ + args.get_message() + ‘<br>’;
displayDiv.innerHTML = markup;
}
</script>
</head>
<body onload="loadGoogleLibAndDraw()">
<form name="metricsform" id="metricsform">
<input id="customListName" name="customListName" value="smartphone_sales" type="hidden"/>
</form>
<div>
<div id="displayDiv"></div>
<div id="BarChart" style="width: 900px; height: 500px;"></div>
<div id="LineChart" style="width: 900px; height: 500px;"></div>
</div>
</body>
</html>
[/html]
- After the page is saved, the screen will automatically reload and display the chart based on the data. Below are a few sample graphs generated using Google Charts.
Troubleshooting
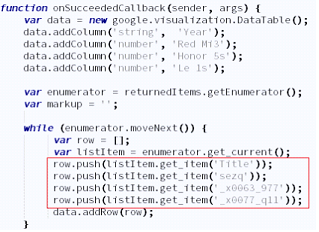
All things considered, if the above code does not work, then you may have to check the column names.
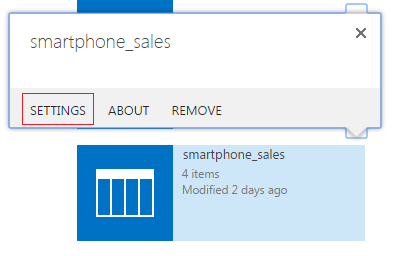
- Go to the Site Contents > ‘smartphone_sales’ > Settings
- Each column is identified by a unique ID, which is auto generated by SharePoint. You can obtain this information from the URL by clicking on the column hyperlink.
- Change the column IDs in the following JavaScript function. This would fix the issues (if any).
Custom Ribbon Action Feature
Additionally, by making use of Custom Ribbon Action, a pop up of SharePoint Modal Dialog of the associated charts can be displayed. This enables users to make changes to the custom list using the quick edit option; the changes are instantly reflected in the charts, making the visualization more interesting.
SharePoint Development and Microsoft SharePoint Services
Being an innovative software development firm specializing in Microsoft technologies, Evoke can help you with Microsoft SharePoint services; we offer end-to-end Microsoft SharePoint solutions for global enterprises. Their comprehensive set of SharePoint services enables enterprises to meet their productivity goals and objectives.
Evoke not only helps global enterprises develop outstanding products, but it also understands their business lifecycle to build highly scalable products. Evoke provides a clear vision and a comprehensive plan to accomplish SharePoint goals. By embracing Evoke’s Microsoft SharePoint Services, an enterprise can improve the overall profit and stay ahead of its competitors.
Call Evoke Technologies at +1 (937) 660-4925 or find out more about how our SharePoint development services can resolve your business problems.
Author
 |
Badiyuzama Mohammad is working as a Technical Lead at Evoke Technologies. He is part of the research and development team at Evoke. He has 8+ years of experience in enterprise software development using Java/J2EE, LAMP, SQL, AngularJS etc. He is keen to explore emerging technologies in open source area. |









46 Comments
Good Job Zama!
Thank you Siva
Very nice and interesting post Zama.
Thank you Jaya, I am glad that you liked the post.
Good Job Zama!
Thank you Bhaskar
I followed the example on SP 2013 but no graph appeared 🙁
Could you please elaborate a bit on the issue? An error message or other details would help me look into the issue.
How can we create effective visualization charts with data stored in excel sheets on SharePoint? Does Google Charts have a free version or any other highly effective options without a high cost? Please suggest
We have to consume REST Excel services to obtain data from Excel stored in SharePoint. Power BI is a highly effective option for dealing with Excel data stored in SharePoint.
Could you please explain if this solution is compatible as well with SharePoint 2010?
How to use this with JSOM? How to adapt the code?
Thanks!
Yes, the solution is compatible with SharePoint 2010. And the answer to your second question is by referring to SP.js and SP.Runtime.js and no change in code.
Hi,
Will you help me how to display data in chart format form SharePoint libraries.
Thanks
Library is also a list and by just replacing the list name with your library name and referring the right column names should help you to generate the charts shown in the post.
Great little tutorial. I got it to work! How can I use a pie chart instead of the bar or line charts? I made some modifications to the code but I cannot get it to work. Please advise. Thank you!
Thanks Darin, new google.charts.Pie should be able to generate a pie chart and also remove bars in the options.
How can I modify the code to use a pie chart instead of a bar or line chart?
Please refer my response below.
Hi, i get this working in an on premise environment, but on sp online it is not working, any advice?
It should be working for both, make sure you are referring to the correct list name and internal column names.
Hello Badiyuzama, I have tried many different ways and many different times but some reason it is now working. I am confused that I have created this chart about few months ago and it was working fine, but suddenly it stop working, please let me know if anything change in the js files? I am not a coder.
best
Dear,
I want to display 6 to 8 different types of graph on a single page in SharePoint Online like bar chart, line chart, pie etc but with different lists and columns of lists. Is it possible with your code?
Secondly i am trying to draw a pie chart but unable to draw can you send me the code to draw a pie chart?
Waiting for your response. Your quick response will be highly appreciated.
Regards,
Zubair
Hello,
I followed your instructions and when I saved the page first time, the graph appeared, although empty because there was no data entered in the list at the time and when I did enter data in my list, I reloaded the page and no graph was shown at all.
I tried downloading the scripts and saving them in SiteAssets and changing the script accordingly, but it didn’t help. I got no error messages.
I tried updating the column IDs, even list ID and still nothing.
What else can I try?
neatly done Zama
Thank you Sanjay
I have added the code and also made changes as per the column names that I have, also did troubleshoot for the list item id but still the chart is not loading even if i add the webpart.
Hi Badiyuzama,
I was trying to run your code with very slight modifications in sharepoint 2013 script editor.
It was running yesterday but it returns a blank page now – I am not sure if I have goofed up somewhere because the script seemed to work pretty well for me.
Pl help. I have tried to ask the same qn on stackoverflow as well.
I run alerts an it gives me alerts after enumerator, after barChart.draw(data, options), lineChart.draw(data, options) and even after google.charts.setOnLoadCallback(visualizeData);
Any help is very appreciated.
Thank you!
https://www.gstatic.com/charts/loader.js
https://code.jquery.com/jquery-3.0.0.min.js
https://cdnjs.cloudflare.com/ajax/libs/jquery.SPServices/2014.02/jquery.SPServices.min.js
var returnedItems = null;
function loadGoogleLibAndDraw(){
google.charts.load(‘current’, {‘packages’:[‘bar’,’line’]});
google.charts.setOnLoadCallback(visualizeData);
}
function visualizeData() {
var context = new SP.ClientContext();
var list = context.get_web().get_lists().getByTitle(document.getElementById(‘customListName’).value);
var caml = new SP.CamlQuery();
caml.set_viewXml(“”);
returnedItems = list.getItems(caml);
context.load(returnedItems);
context.executeQueryAsync(onSucceededCallback, onFailedCallback);
}
function onSucceededCallback(sender, args) {
var data = new google.visualization.DataTable();
data.addColumn(‘string’, ‘Part No’);
data.addColumn(‘number’, ‘Volume’);
var enumerator = returnedItems.getEnumerator();
var markup = ”;
while (enumerator.moveNext()) {
var row = [];
var listItem = enumerator.get_current();
row.push(listItem.get_item(‘Part_x0020_No’));
row.push(listItem.get_item(‘Volume’));
data.addRow(row);
}
var options = {
chart: {
title: ‘KPIs’,
},
bars: ‘vertical’
};
var barChart = new google.charts.Bar(document.getElementById(‘BarChart’));
barChart.draw(data, options);
var lineChart = new google.charts.Line(document.getElementById(‘LineChart’));
lineChart.draw(data, options);
}
function onFailedCallback(sender, args) {
var markup = ‘The request failed: ‘;
markup += ‘Message: ‘ + args.get_message() + ”;
displayDiv.innerHTML = markup;
}
Hi Badiyuzama,
I gotta say thanks for this nice post. It works like a charm. Thanks for sharing again.
Regards,
Viet K.
Thank you Viet, I am glad that you liked the blog post
Best Regards,
Zama
This is great.
Got it working with your sample data.
Can it sum non table data ? i.e. Count ID by date or week ?
Badiyuzama Mohammad,
I have tried this charts it is worked perfectly, I want two charts in same page, I have tried but not getting charts. Only one chart displayed at a time please suggest me in attached the code also:
/*code for two charts in same page*/
https://www.gstatic.com/charts/loader.js
https://code.jquery.com/jquery-3.0.0.min.js
https://cdnjs.cloudflare.com/ajax/libs/jquery.SPServices/2014.02/jquery.SPServices.min.js
var returnedItems = null;
var returnedItems1 = null;
function loadGoogleLibAndDraw(){
google.charts.load(‘visualization’, ‘1’, {packages: [‘corechart’]});
google.charts.load(‘current’, {‘packages’:[‘corechart’]});
google.charts.setOnLoadCallback(visualizeData1);
google.charts.setOnLoadCallback(visualizeData2);
}
function visualizeData1() {
var context = new SP.ClientContext();
var list = context.get_web().get_lists().getByTitle(document.getElementById(‘customListName’).value);
var caml = new SP.CamlQuery();
caml.set_viewXml(“”);
returnedItems = list.getItems(caml);
context.load(returnedItems);
context.executeQueryAsync(onSucceededCallback, onFailedCallback);
}
function onSucceededCallback(sender, args) {
var data = new google.visualization.DataTable();
data.addColumn(‘string’, ‘DM’);
data.addColumn(‘number’, ‘Offshore’);
data.addColumn(‘number’, ‘Onsite’);
var enumerator = returnedItems.getEnumerator();
var markup = ”;
while (enumerator.moveNext()) {
var row = [];
var listItem = enumerator.get_current();
row.push(listItem.get_item(‘Title’));
row.push(listItem.get_item(‘Offshore’));
row.push(listItem.get_item(‘Onsite’));
data.addRow(row);
}
var options = {
title: ‘Head count’,
isStacked:true,
};
var chart = new google.visualization.ColumnChart(document.getElementById(‘BarChart’));
chart.draw(data, options);
}
function onFailedCallback(sender, args) {
var markup = ‘The request failed: ‘;
markup += ‘Message: ‘ + args.get_message() + ”;
displayDiv.innerHTML = markup;
}
function visualizeData2() {
var context1 = new SP.ClientContext();
var list1= context1.get_web().get_lists().getByTitle(document.getElementById(‘customListName1’).value);
var caml1 = new SP.CamlQuery();
caml1.set_viewXml(“”);
returnedItems1= list1.getItems(caml1);
context1.load(returnedItems1);
context1.executeQueryAsync(onSucceededCallback1, onFailedCallback1);
}
function onSucceededCallback1(sender, args) {
var data1 = new google.visualization.DataTable();
data1.addColumn(‘string’, ‘DM’);
data1.addColumn(‘number’, ‘April’);
data1.addColumn(‘number’, ‘May’);
data1.addColumn(‘number’, ‘June’);
var enumerator1 = returnedItems1.getEnumerator();
var markup1 = ”;
while (enumerator1.moveNext()) {
var row1= [];
var listItem1 = enumerator.get_current();
row1.push(listItem1.get_item(‘Title’));
row1.push(listItem1.get_item(‘April’));
row1.push(listItem1.get_item(‘May’));
row1.push(listItem1.get_item(‘June’));
data1.addRow(row1);
}
var options1 = {
title: ‘Revenue’,
};
var chart1= new google.visualization.PieChart(document.getElementById(‘piechart’));
chart1.draw(data1, options1);
}
function onFailedCallback1(sender, args) {
var markup1= ‘The request failed: ‘;
markup1 += ‘Message: ‘ + args.get_message() + ”;
displayDiv.innerHTML = markup1;
}
Badiyuzama Mohammad,
Hi,
I have built this charts based on your link it has worked perfectly, I passed data through Excel and SharePoint list, I want to click this chart so that excel file will open, I have tried this but not getting the expected result. Please suggest me in below attached that code also.
/*code for charts*/
https://www.gstatic.com/charts/loader.js
https://code.jquery.com/jquery-3.0.0.min.js
https://cdnjs.cloudflare.com/ajax/libs/jquery.SPServices/2014.02/jquery.SPServices.min.js
var returnedItems = null;
function loadGoogleLibAndDraw(){
google.charts.load(‘visualization’, ‘1’, {packages: [‘corechart’]});
google.charts.setOnLoadCallback(visualizeData);
}
function visualizeData() {
var context = new SP.ClientContext();
var list = context.get_web().get_lists().getByTitle(document.getElementById(‘customListName’).value);
var caml = new SP.CamlQuery();
caml.set_viewXml(“”);
returnedItems = list.getItems(caml);
context.load(returnedItems);
context.executeQueryAsync(onSucceededCallback, onFailedCallback);
}
function onSucceededCallback(sender, args) {
var data = new google.visualization.DataTable();
data.addColumn(‘string’, ‘DM’);
data.addColumn(‘number’, ‘Offshore’);
data.addColumn(‘number’, ‘Onsite’);
var enumerator = returnedItems.getEnumerator();
var markup = ”;
while (enumerator.moveNext()) {
var row = [];
var listItem = enumerator.get_current();
row.push(listItem.get_item(‘Title’));
row.push(listItem.get_item(‘Offshore’));
row.push(listItem.get_item(‘Onsite’));
data.addRow(row);
}
var options = {
title: “Head count”,
isStacked: true,
legend:’none’,
colors: [
‘#FF8080’,
‘#8080FF’,
‘#FF0000’,
‘#0000FF’]
};
var barChart = new google.visualization.ColumnChart(document.getElementById(‘BarChart’));
barChart.draw(data, options);
}
function onFailedCallback(sender, args) {
var markup = ‘The request failed: ‘;
markup += ‘Message: ‘ + args.get_message() + ”;
displayDiv.innerHTML = markup;
}
Hi,
I have a lookup column which holds my count value. i have to bind the count in one of my columns in datatable as a number value how do i convert the column into number type please help
Hi,
I follow your every steps.
I download these files.
https://www.gstatic.com/charts/loader.js
https://code.jquery.com/jquery-3.0.0.min.js
https://cdnjs.cloudflare.com/ajax/libs/jquery.SPServices/2014.02/jquery.SPServices.min.js
Save it on document library . Name are loader.js, jquery.js and SPServices.js.
I link these on html like these.
http://server1:2366/dashboard/Test1/loader.js
http://server1:2366/dashboard/Test1/jquery_min.js
http://server1:2366/dashboard/Test1/SPServices.js
……………………………..
I check my column name and change on html like below.
row.push(listItem.get_item(‘Title’));
row.push(listItem.get_item(‘Red%5Fx0020%5FMi3%5Fx2019%5F’));
row.push(listItem.get_item(‘Honor%5Fx0020%5F5s’));
row.push(listItem.get_item(‘Le%5Fx0020%5F1s’));
….
I add list and add WebParts as per your Blogs .
But When I save it it does not show the graph .
I am uses SP server 2016.
I check on inspect there I saw that loader,js create twice . one is blank .
Is show the error like that :
GET https://www.gstatic.com/charts/45.2/loader.js net::ERR_NAME_RESOLUTION_FAILED
Please let me know.
Md Maidul Islam
I am new on SP , html , JS, and Jquery.
Please Explain what did I have done mistake.
You need to exchange the ascii underscore character %5F with _
So should be:
row.push(listItem.get_item(‘Red_x0020_Mi3_x2019_’));
row.push(listItem.get_item(‘Honor_x0020_5s’));
row.push(listItem.get_item(‘Le_x0020_1s’));
Hello,
Do any one have any idea, why its not working in SharePoint 2016. I am doing step by step as suggested. But getting just a blank page.
Its Annoying !
Is there a way when we can click on the graphs it links back to the SharePoint list it was used to generate the graph.
That was awesome. Worked perfectly.
I have tried every possible way and it is not work, anyone can help please?
Is this function compatible with SP 16? I continue to get a blank page. Thank you
Hello, does anyone know how to make this code work? It was working few months back but now, it is not working, I was wondering what happened?
Hi, did chart work for you?
Is anyone able to change the chart format into something else? For me anytime of change it, nothing will load. However, I can add “scatter” and it works but every other type causes the graph to disappear. (Likely because of an error trying to load said line.)
google.charts.load(‘current’, {‘packages’:[‘bar’,’line’]}); — This works fine
google.charts.load(‘current’, {‘packages’:[‘bar’,’line’,’pie’]}); — This does not
google.charts.load(‘current’, {‘packages’:[‘bar’,’line’,’scatter’]}); — This works fine
I thought at first it was just an error with the naming of other kinds of charts but I have tried everything! Only scatter will advance without error on load. Someone please assist!
*Using sharepoint 2013 on prem
Do we need to mention path of List any where ?
i need help that i need to count that data of particular list. As in if i have to represent that count of all 3 years for RedmI, honor and Le and then have to represent it in graph. Also, need help with not able to connect the link as well.
hello. i was able to get it to work in sharepoint 2016. the issue is it only shows up when i put the page in edit but when i take it out of edit, it disappears.